In containerized, multi-tenant environments, GPUs are both the most valuable and the hardest resources to manage. The traditional exclusive model wastes capacity and makes sharing painful. What production teams need is a GPU virtualization path that is schedulable by Kubernetes, enforceable at container boundaries, and observable for operations. gpu-manager fits that need: it plugs into kubelet as a device plugin, exposes vGPU resources, and enforces limits by intercepting CUDA calls at runtime.
This article uses the gpu-manager startup flow as the backbone, and extends it with scheduling strategy, topology awareness, ops governance, and risk boundaries. The result is a long-form, engineering-oriented guide for platform and Kubernetes teams.
1. Why GPU virtualization must be engineered
GPUs differ from CPUs not just in raw compute and in how they are used. CPUs are naturally schedulable at the process level, while GPUs depend heavily on user-space libraries and a complex driver stack. In container environments, GPU management often stops at “full device exclusive.” The consequences are clear:
- Waste: small inference jobs consume a whole card.
- Tenant conflicts: there is no reliable way to cap usage per container.
- Coarse scheduling: Kubernetes only sees whole GPUs, not partial capacity.
- Ops complexity: driver/library upgrades can cause global failures.
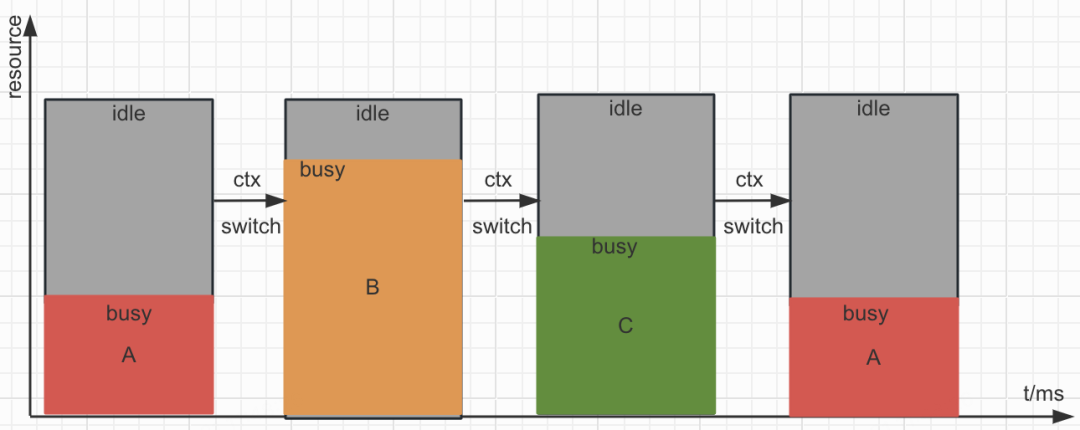
GPU resource slicing can be understood from two dimensions. In the space dimension, a single dispatch rarely saturates all GPU cores, leaving utilization low. In the time dimension, multiple tasks take turns running with switching and waiting overhead; latency-sensitive high-priority jobs often monopolize a whole card just to guarantee SLA. Space-division approaches aim for true parallelism to fill idle compute, while time-division approaches control time slices to reduce switching overhead and better reclaim idle resources.
gpu-manager addresses three engineering questions:
- How to split GPU resources: expose compute and memory as separate dimensions.
- How to enforce the split: intercept CUDA calls and apply limits.
- How to schedule optimally: use topology awareness to avoid slow paths.
Together, these pieces form a concrete, engineered GPU virtualization path.
2. CUDA Software Stack
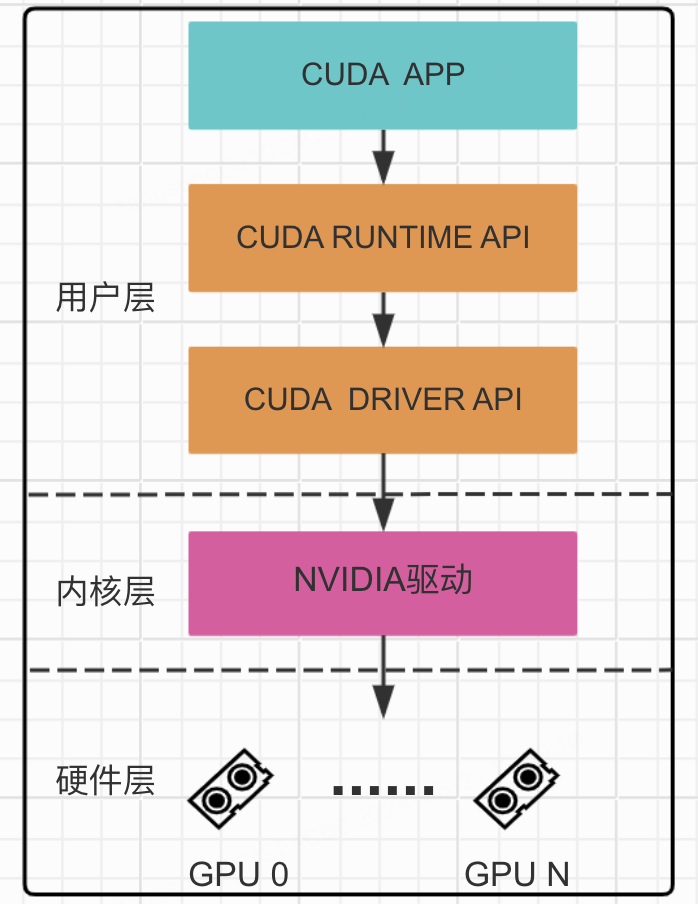
Understanding GPU isolation requires knowing where interception can happen. The CUDA software stack has four layers from top to bottom:
- Application: user CUDA programs calling CUDA APIs.
- CUDA libraries: split into CUDA Runtime API (higher-level,
cudartdynamic library,cuda-prefixed entry points) and CUDA Driver API (lower-level,cudadynamic library,cu-prefixed entry points, finer control over context and module loading). - Kernel driver: NVIDIA GPU driver, managing GPU resources and OS interaction.
- GPU hardware: the physical device providing parallel compute.
Every hop from API to hardware can be intercepted. The industry has built various GPU isolation solutions at different layers of this stack.
3. GPU Driver Scheduling Internals
When a CUDA program submits work to the GPU, the driver orchestrates execution through a fine-grained scheduling mechanism. The GPU consists of multiple functional units called Engine:
- Compute/Graphics Engine: general-purpose cores for CUDA compute and graphics.
- Copy Engine: handles async data transfer between GPU and CPU.
- NVENC/NVDEC Engine: video encoding/decoding.
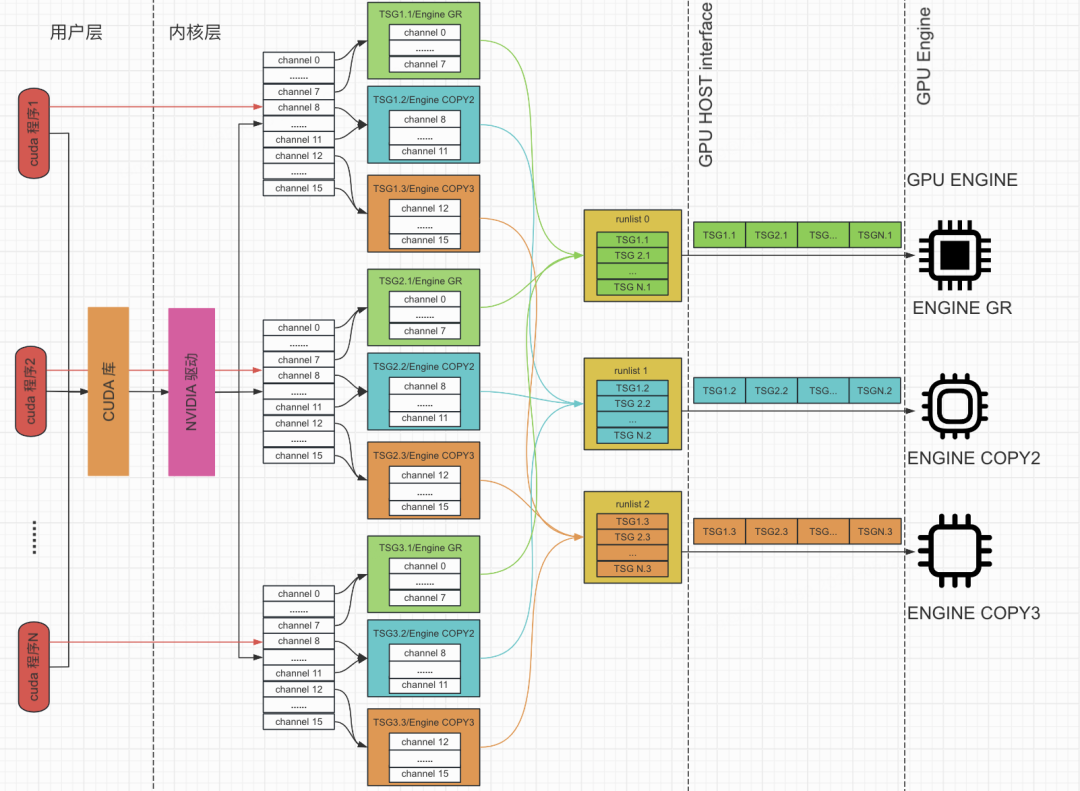
The GPU Host bridges the CPU and GPU. It contains a runlist processor that scans runlists for the next channel to run, and a context switcher that swaps engine state when switching between channels with different contexts.
The scheduling flow works as follows:
- The driver creates one or more channels per program for submitting compute or copy requests.
- Channels are grouped into TSG (Time Slice Group). Channels in the same TSG share the same GPU context.
- Each TSG finds its runlist based on its assigned Engine type.
- The GPU Host picks a TSG from the runlist in round-robin fashion, selects a channel from that TSG, and dispatches it to the engine.
- The engine executes the submitted commands.
On an A10 GPU, tracing a typical CUDA program shows 16 channels, 3 TSGs, and 3 runlists by default: 8 compute channels in one TSG (Compute/Graphics Engine), 8 copy channels split across two TSGs (two Copy Engine types). Each Engine type is bound to one runlist.
The Timeslice is the maximum time a TSG can run before the next switch. On runlist0 the default is 2ms. A TSG keeps the engine until its timeslice expires or its work finishes early. This means TSG switching and context switching are the dominant factors for multi-tenant latency on a shared GPU.
4. Industry GPU Isolation Solutions
Space-division solutions are dominated by NVIDIA’s MPS and MIG. Time-division solutions include CUDA hijacking and kernel interception.
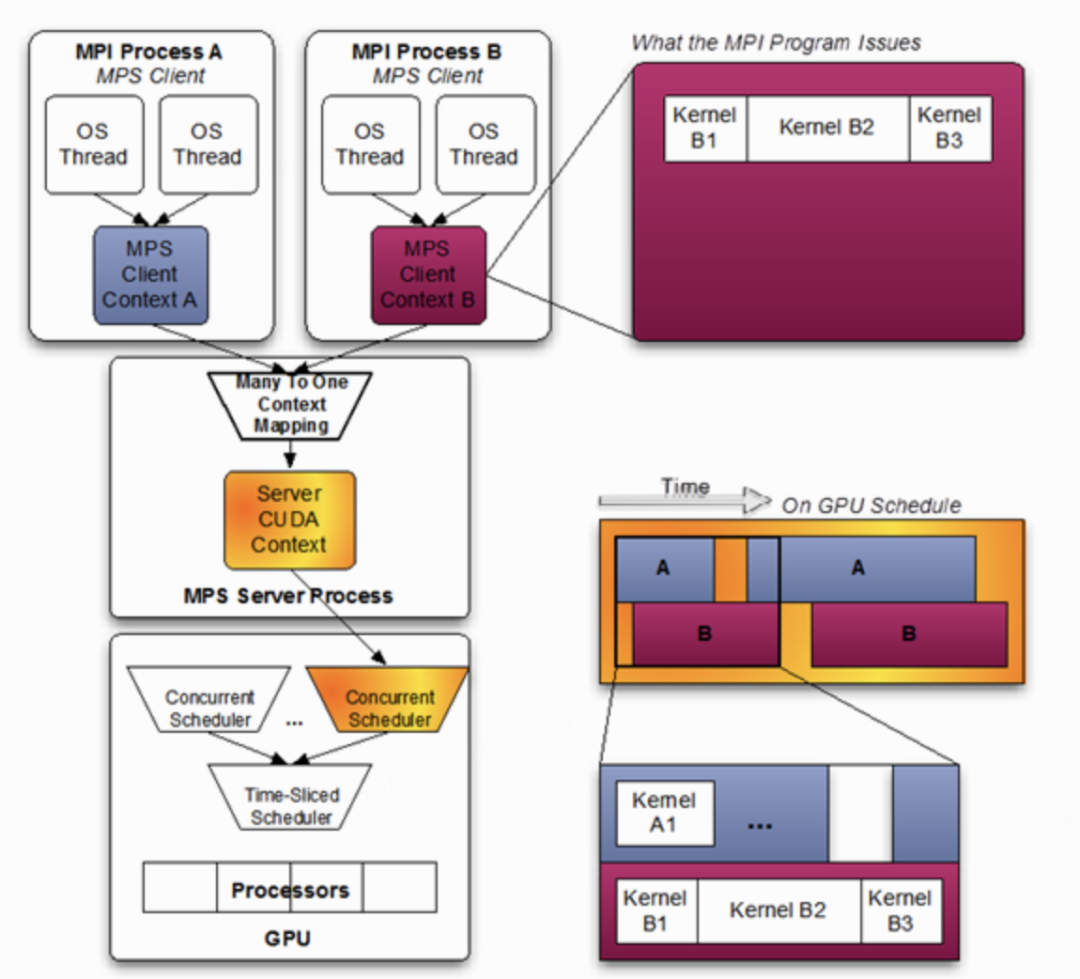
4.1 MPS
MPS merges multiple CUDA contexts into one, allowing tasks to share GPU compute and memory. A single context means a task failure affects all merged tasks (fault propagation), and the black-box logic makes diagnosis difficult.
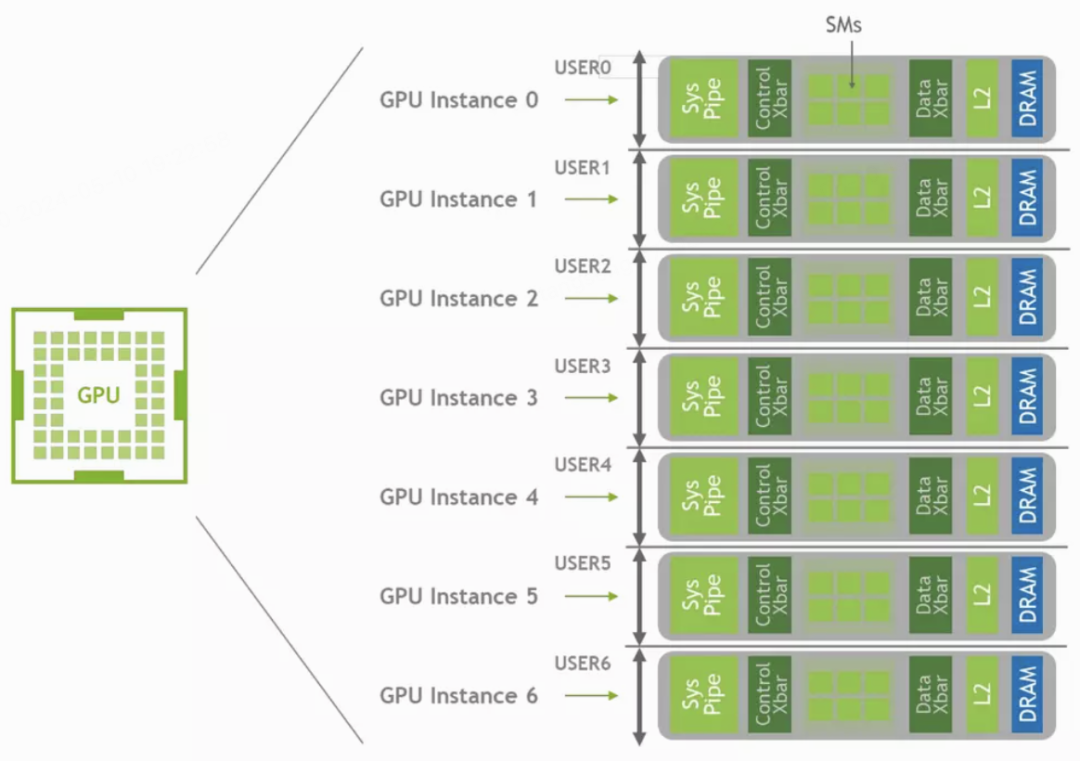
4.2 MIG
Introduced with A100, MIG partitions a single GPU into hardware-isolated instances with dedicated resources. Limitations: high-end GPUs only, max 7 instances, static partitioning that cannot be changed at runtime.
4.3 CUDA Hijacking
CUDA hijacking intercepts calls between the Runtime and Driver API layers. A representative is Tencent’s early GaiaGPU: it evaluates each kernel launch’s utilization impact and delays launches that would exceed quotas. Because the API surface is public, hijacking can cleanly reject or defer requests, but it lacks feedback on actual consumption (polling-based wastage) and loses control after the request is submitted.
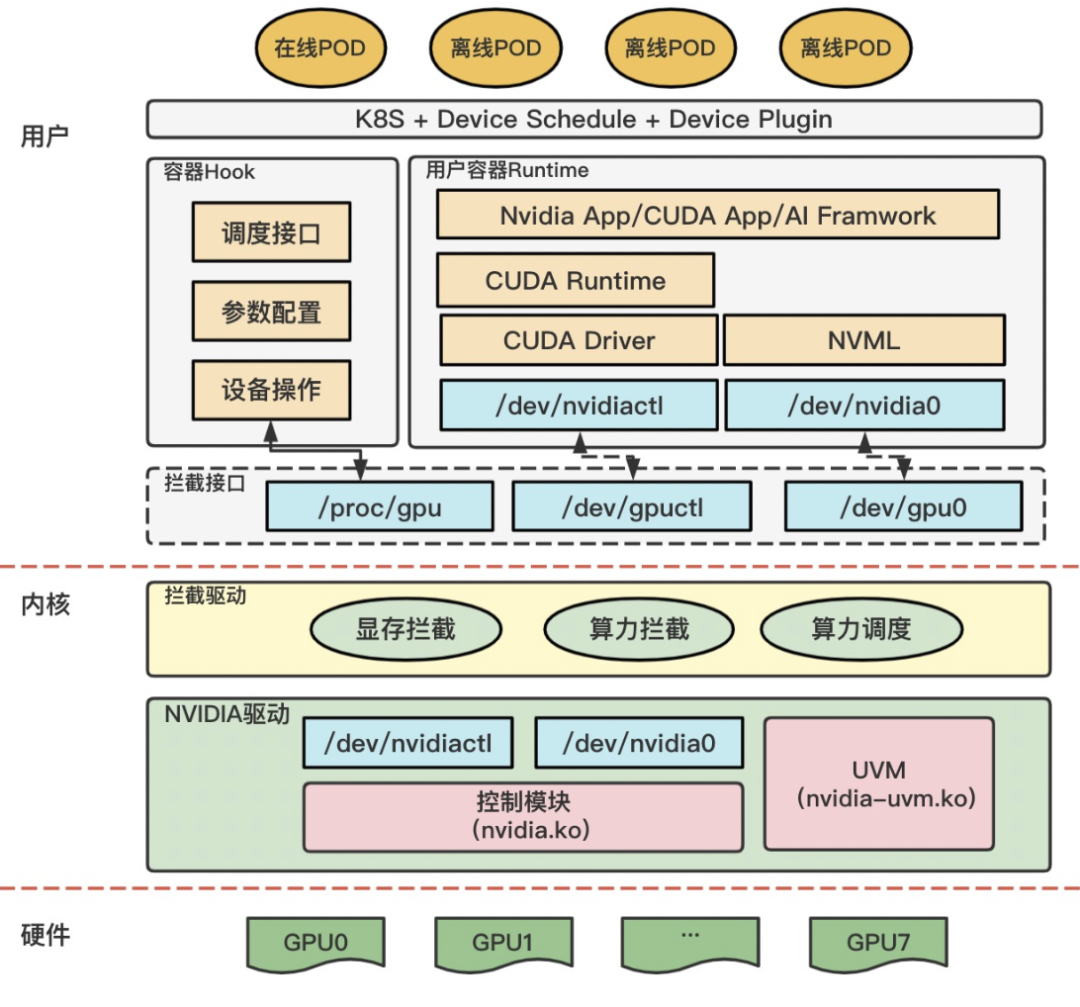
4.4 Kernel Interception
Kernel interception sits between CUDA Driver API and the NVIDIA driver. Tencent qGPU, Alibaba cGPU, and Baidu’s GPU isolation all follow this pattern. The approach exposes fake device files (e.g., /dev/gpu0) so app calls route through an interception layer that parses and modifies parameters before forwarding to the real driver. Downside: the GPU interaction model is a black box; driver version changes can break the interception layer, making maintenance costly.
These approaches (MPS/MIG/CUDA hijacking/kernel interception) are complementary to gpu-manager’s software interception at different layers. Choose MIG for strong isolation on supported hardware; MPS for inference concurrency; gpu-manager for heterogeneous fleets needing unified scheduling.
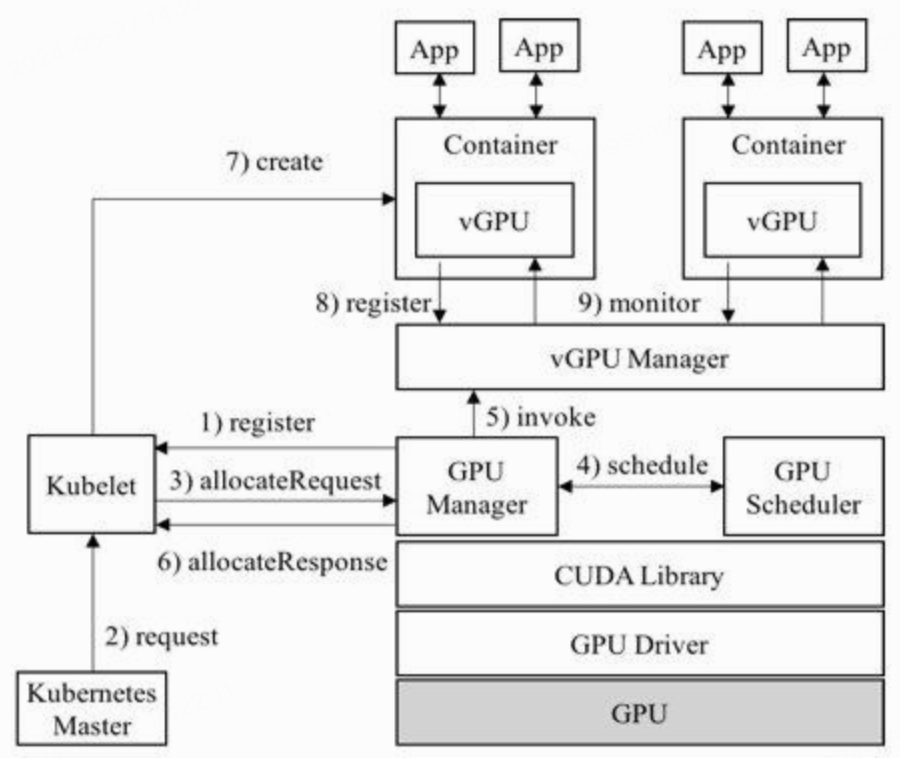
5. gpu-manager in the Gaia Scheduler ecosystem
gpu-manager is one component in a larger GPU scheduling stack. The roles are:
- GPU Manager: registers GPU resources with kubelet via device plugin.
- GPU Scheduler: chooses the best GPU allocation inside a node.
- vGPU Manager: manages the lifecycle and reclamation of vGPU usage.
- vGPU Library: intercepts CUDA API calls through
libcuda-control.so.
gpu-manager integrates GPU Manager and vGPU Library into a single project, enabling GPU virtualization without special hardware. This matters for environments with mixed or older GPU fleets where hardware-level partitioning (like MIG) is not always available.
6. Device plugin: make GPUs schedulable resources
Kubernetes does not understand GPUs natively. The device plugin API is the extension point. gpu-manager registers two custom resources:
tencent.com/vcuda-core: compute capacity.tencent.com/vcuda-memory: GPU memory capacity.
That means Pods can request partial GPU resources instead of whole cards. gpu-manager uses Allocate to inject devices and configuration into containers, while vGPU Library enforces limits at runtime.
From an engineering perspective, this provides:
- Declarative GPU resources in Pod specs.
- Finer matching in the scheduler.
- Structured inputs for monitoring and recovery.
Below is a minimal Pod example requesting vcuda resources:
apiVersion: v1
kind: Pod
metadata:
  name: demo-vcuda
spec:
  containers:
    - name: demo
      image: nvidia/cuda:12.2.0-base
      resources:
        requests:
          tencent.com/vcuda-core: "20"
          tencent.com/vcuda-memory: "8Gi"
        limits:
          tencent.com/vcuda-core: "20"
          tencent.com/vcuda-memory: "8Gi"
7. Startup flags: understand behavior boundaries
gpu-manager behavior is defined by its flags. Key ones include:
driver: GPU driver type, default is nvidia.extra-config: extension config for custom policies.volume-config: list of libraries and binaries to intercept.docker-endpoint: container runtime socket.query-port: metrics/monitoring query port.kubeconfig: auth config for cluster access.standalone: standalone mode for debugging.sample-period: metrics sampling interval.node-labels: apply labels to GPU nodes.hostname-override: limit scope to the local node.virtual-manager-path: path for per-pod state.device-plugin-path: device plugin socket path.checkpoint-path: allocation state persistence.share-mode: enable shared vGPU mode.allocation-check-period: periodic reconciliation.incluster-mode: run inside the cluster.
These flags cover discovery, allocation, monitoring, and recovery. In production, volume-config and checkpoint-path are the most critical.
8. Startup flow overview
gpu-manager startup can be summarized as:
- Run
VolumeManagerto mirror and replace driver/CUDA libraries. - Start watchdog and build Pod state cache.
- Apply node labels for scheduling.
- Start
VirtualManagerfor vGPU lifecycle. - Discover GPU topology.
- Initialize allocator.
- Start services: vcuda, vmemory, display, metrics.
- Register device plugin to kubelet.
The two most important stages are driver mirroring + CUDA interception and topology-aware allocation.
A simplified flow chart:
+-----------+    +----------------+    +-------------------+
| Run()     | -> | VolumeManager  | -> | Watchdog/Labeling |
+-----------+    +----------------+    +-------------------+
                         |                       |
                         v                       v
                +------------------+    +-------------------+
                | Topology Discover| -> | Allocator Init    |
                +------------------+    +-------------------+
                                              |
                                              v
                                   +------------------------+
                                   | Start gRPC Services    |
                                   | (vcuda/vmemory/metrics)|
                                   +------------------------+
                                              |
                                              v
                                   +------------------------+
                                   | Register to kubelet    |
                                   +------------------------+
And the core startup sequence in pseudocode:
func (m *managerImpl) Run() error {
    if err := m.volumeManager.Run(); err != nil {
        return err
    }
    m.watchdog.Start()
    m.labeler.Apply()

    tree := m.discoverGPUTopology()
    m.allocator = m.initAllocator(tree)

    m.startServices() // vcuda/vmemory/display/metrics
    return m.RegisterToKubelet()
}
9. VolumeManager: the CUDA interception entry point
VolumeManager constructs a “controlled driver view” by:
- Using
ldcacheto find library paths. - Using
whichto find binaries. - Mirroring files into
/etc/gpu-manager/vdriver. - Recording
libcuda.soversion. - Locating
libcuda-control.soas the interceptor. - Replacing
libcuda.soandlibnvidia-ml.solinks to route calls.
This approach is non-invasive: it does not modify the system driver in place. Instead, it creates a mirrored driver tree and lets containers load the intercepted libraries via LD_LIBRARY_PATH.
Key benefits:
- Rollbackable: remove the plugin and restore original behavior.
- Compatible: no kernel patch or special hardware required.
- Operable: all interception logic lives in a single directory.
A simplified VolumeManager sketch:
func (vm *VolumeManager) Run() error {
    cache, err := ldcache.Open()
    if err != nil {
        return err
    }
    defer cache.Close()

    vols := make(VolumeMap)
    for _, cfg := range vm.Config {
        vol := &Volume{Path: path.Join(cfg.BasePath, cfg.Name)}
        for t, c := range cfg.Components {
            switch t {
            case "binaries":
                bins, _ := which(c...)
                vol.dirs = append(vol.dirs, volumeDir{binDir, bins})
            case "libraries":
                libs32, libs64 := cache.Lookup(c...)
                vol.dirs = append(vol.dirs, volumeDir{lib32Dir, libs32})
                vol.dirs = append(vol.dirs, volumeDir{lib64Dir, libs64})
            }
        }
        vols[cfg.Name] = vol
    }

    return vm.mirror(vols)
}
10. Mirroring and replacement: why not a plain copy
Dynamic libraries rely on soname symlinks. If you copy the file without creating the soname link, loaders fail at runtime. mirrorFiles handles both file cloning and soname link creation. In shared mode, it removes libcuda.so and libnvidia-ml.so symlinks and replaces them with the interception library.
This ensures:
- Correct runtime library resolution.
- A consistent interception entry point.
- No bypass of the control layer.
The interception chain can be summarized as:
App -> libcuda.so (vdriver) -> libcuda-control.so -> libcuda.so (origin)
A simplified mirror routine:
func (vm *VolumeManager) mirrorFiles(driver, vpath, file string) error {
    obj, err := elf.Open(file)
    if err != nil {
        return err
    }
    defer obj.Close()

    if ok, _ := blacklisted(file, obj); ok {
        return nil
    }

    dst := path.Join(vpath, path.Base(file))
    _ = removeFile(dst)
    if err := clone(file, dst); err != nil {
        return err
    }

    soname, _ := obj.DynString(elf.DT_SONAME)
    if len(soname) > 0 {
        linkIfNotSameName(path.Base(file), path.Join(vpath, soname[0]))
    }

    if vm.share && driver == "nvidia" && strings.HasPrefix(soname[0], "libcuda.so") {
        os.Remove(path.Join(vpath, soname[0]))
        vm.cudaSoname[path.Join(vpath, soname[0])] = path.Join(vpath, soname[0])
    }

    return nil
}
11. vGPU Library: the CUDA interception core
libcuda-control.so is the key output of vGPU Library. It does not create a hardware-virtual GPU. Instead, it intercepts CUDA calls and applies limits and accounting. Typical interception includes:
- Guarding
cudaMalloc/cudaMemcpywith quotas. - Tracking execution to estimate compute usage.
- Isolating contexts to prevent tenant interference.
This approach avoids application changes, but depends on CUDA/driver compatibility. Any driver upgrade requires validation against the interception library.
12. Topology awareness: performance-critical scheduling
GPUs are not uniform resources. Topology affects latency and bandwidth:
- PCIe topology: cross-switch hops add latency.
- NUMA: remote memory access is slower.
- NVLink: higher GPU-GPU bandwidth for multi-GPU jobs.
- Root complex locality: often faster than cross-root paths.
gpu-manager builds a GPU topology tree and chooses allocations with optimal connectivity, which can materially change training throughput and stability.
13. Allocator: from “available” to “optimal”
Allocator aims for the best allocation under shared constraints. Initialization steps include:
- Load kernel modules.
- Initialize evaluators.
- Load extra config.
- Start background goroutines for results.
- Recover state from checkpoint.
- Periodically reconcile allocations.
Evaluator design enables strategy extensions:
- Minimize fragmentation.
- Prefer optimal topology.
- Prioritize memory capacity.
- Balance across GPUs.
Training jobs care about topology and bandwidth; inference cares about density and memory isolation.
14. Registration and Allocate: kubelet interaction
gpu-manager registers via gRPC to the kubelet socket, one request per resource, and sets PreStartRequired. This gives the plugin a pre-start hook to prepare mounts and env injections.
Allocate typically performs:
- Request validation.
- Device or vGPU selection.
- Driver/library mounts.
- Environment injection.
- Allocation persistence.
If Allocate fails, the container fails to start, so this path determines platform reliability.
Simplified registration code:
func (m *managerImpl) RegisterToKubelet() error {
    socketFile := filepath.Join(m.config.DevicePluginPath, types.KubeletSocket)
    conn, err := grpc.Dial(socketFile, grpc.WithInsecure(), grpc.WithBlock())
    if err != nil {
        return err
    }
    defer conn.Close()

    client := pluginapi.NewRegistrationClient(conn)
    for _, srv := range m.bundleServer {
        req := &pluginapi.RegisterRequest{
            Version:      pluginapi.Version,
            Endpoint:     path.Base(srv.SocketName()),
            ResourceName: srv.ResourceName(),
            Options:      &pluginapi.DevicePluginOptions{PreStartRequired: true},
        }
        if _, err := client.Register(context.Background(), req); err != nil {
            return err
        }
    }
    return nil
}
Allocate sketch:
func (s *vcudaServer) Allocate(ctx context.Context, req *pluginapi.AllocateRequest) (*pluginapi.AllocateResponse, error) {
    devices := s.pickDevices(req)
    mounts := s.prepareMounts(devices)
    envs := s.injectEnv(devices)
    return buildAllocateResp(mounts, envs), nil
}
Allocate call flow:
Pod Spec -> Scheduler -> kubelet -> device plugin Allocate
                              |                |
                              v                v
                         Mount vdriver     Inject env/config
                              |
                              v
                           Start container
15. Checkpoint and recovery: production readiness
After a restart, gpu-manager must restore allocations, or risk resource leakage or double allocation. The recovery flow:
- Read checkpoint state.
- Inspect running containers via the runtime.
- Reconcile and repair state.
- Update caches.
Store checkpoint data on stable storage to avoid loss on restart.
16. Monitoring and ops: from “working” to “operable”
gpu-manager exposes metrics for Prometheus. Key metrics include:
- GPU compute and memory utilization.
- Virtual allocation vs. actual usage.
- Allocation failures.
- Pod-to-GPU binding relationships.
Operational practices:
- Alert on plugin registration failures.
- Audit
vdriverand interception library versions. - Use canary nodes for driver upgrades.
17. Failure cases and risk boundaries
Common issues include:
- Driver mismatch:
libcuda-control.sodoes not match the driver version, causing CUDA init failures. - Interception bypass: containers override
LD_LIBRARY_PATHor mount custom CUDA, bypassing control. - Socket permission issues: device plugin cannot register to kubelet.
- Checkpoint corruption: crashes or disk cleanup corrupt state.
- Performance jitter: shared mode introduces contention and variability.
18. Deployment checklist
- Node readiness
- Consistent driver version.
- CUDA runtime installed.
- Record or disable conflicting GPU monitoring tools.
- Config readiness
volume-configpoints to correct libraries.checkpoint-pathon stable storage.sample-periodtuned for your observability needs.
- Deployment
- DaemonSet on GPU nodes.
- Node selectors or taints for isolation.
- Validation
- Verify device plugin registration.
- Run a simple CUDA container.
- Check metrics output.
19. Scheduling strategy by workload
- Training: prioritize topology and bandwidth.
- Inference: prioritize density and memory isolation.
- Mixed: isolate training from inference and protect priorities.
Possible strategy combinations:
- Bind training to NVLink-friendly GPUs.
- Pack inference into remaining capacity.
- Reserve resources for high-priority jobs.
20. Fairness in shared mode
Shared mode improves utilization but raises fairness issues. Different kernels contend differently; memory quotas alone do not guarantee fair compute. Common mitigations:
- Queue-based concurrency limits.
- Runtime scheduling layers for GPU access.
- Per-tenant throttling.
21. Future evolution
gpu-manager can evolve in multiple directions:
- Finer-grained resource models (SM/Tensor Core).
- Elastic allocation and reclamation.
- Cross-node scheduling optimization.
- Multi-dimensional QoS (throughput, latency, fairness).
22. Runtime interception perspective
gpu-manager virtualization is about redirecting user-space calls. The dynamic loader resolves libraries based on LD_LIBRARY_PATH, rpath, and default search paths. By placing intercepted libraries earlier in the search path, gpu-manager ensures CUDA calls pass through the control layer.
Interception patterns include:
- Function-level proxying: intercept
cudaMalloc,cudaFree,cuCtxCreateand apply quotas. - Device enumeration rewriting: expose virtual devices to the container.
- Policy injection: pass quotas/time-slice policies via env or shared memory.
To keep enforcement reliable, platforms must prevent containers from bypassing the interception path. Admission rules, image controls, and read-only mounts help enforce this.
23. Performance evaluation and benchmarking
A concrete evaluation plan should cover more than utilization:
- Single-job baseline: establish throughput/latency under exclusive use.
- Multi-tenant contention: measure degradation and fragmentation.
- Topology-sensitive tests: compare NVLink vs PCIe layouts.
- Recovery tests: restart gpu-manager and verify checkpoint recovery.
- Extreme quota tests: validate strict enforcement under low limits.
Only when these scenarios remain stable can the system be considered production-grade.
24. Troubleshooting and FAQ
- Pods stuck in Pending: check whether custom resources are visible and device plugin registration succeeded.
- CUDA init fails in container: verify
LD_LIBRARY_PATHand interception library version. - Wrong GPU visibility: validate device filters injected by Allocate.
- Metrics mismatch: compare node metrics and container observations for sampling gaps.
- Post-restart anomalies: verify checkpoint integrity and container reconciliation.
25. Example: mixed training and inference scheduling
Assume a team runs two workloads:
- Offline training: multi-GPU, throughput sensitive, long-running.
- Online inference: single-GPU multi-tenant, latency sensitive.
In exclusive mode, these workloads cannot share GPU efficiently. With gpu-manager shared mode, a balanced plan could be:
- Training requests
vcuda-core=80,vcuda-memory=80Gi, and prefers topological locality. - Inference requests
vcuda-core=20,vcuda-memory=8Gi, with faster sampling. - When training load drops, inference pods are packed into the freed capacity.
Expected outcomes:
- Training keeps bandwidth-optimized placement.
- Inference density increases without hurting training.
- Ops can watch fragmentation trends through metrics.
26. Organizational and process recommendations
GPU virtualization is not just technical; process maturity is equally important. Common blockers are inconsistent resource requests, unclear cost signals, and lack of performance validation. Practical recommendations:
-
Standardize resource requests Require both compute and memory requests, plus duration or concurrency estimates.
-
Capacity and cost visibility Expose utilization and allocation ratios in dashboards so teams understand cost impact.
-
Performance regression workflows Use canary nodes and run benchmarks before full rollout of drivers/interception libs.
-
Root cause attribution Separate app issues from virtualization issues using baselines and node comparison.
-
Cross-team coordination Set unified change windows and upgrade cadence across infra, platform, and ML teams.
Without this process layer, strong technical capability still fails to translate into durable value.
27. Closing
gpu-manager is more than a device plugin. It offers a complete engineering path for GPU virtualization in Kubernetes: driver mirroring and CUDA interception, topology-aware allocation, runtime recovery, and observability. This shifts GPU platforms from “device management” to “resource governance”—when GPUs are measurable, splittable, schedulable, and auditable, organizations gain clear cost structure and performance boundaries.
Start small: pilot with a few nodes and representative workloads, validate stability and performance, then expand. Maintain compatibility between drivers and interception libraries, and keep the monitoring pipeline healthy to avoid short-term success becoming long-term risk.
The goal is not simply to run more Pods on GPUs. It is to build a predictable, governable, sustainable GPU resource marketplace. gpu-manager provides infrastructure capability; its value depends on alignment across scheduling policy, workload needs, and operational process.
References
- https://ieeexplore.ieee.org/document/8672301
- CUDA Toolkit Documentation 12.4 Update 1 - https://docs.nvidia.com/cuda/index.html
- GPU Virtualization, Compute Isolation, and qGPU - https://zhuanlan.zhihu.com/p/377073683
- Multi-Process Service - https://docs.nvidia.com/deploy/mps/index.html
- MIG User Guide - https://docs.nvidia.com/datacenter/tesla/mig-user-guide/index.html
- GaiaGPU: Sharing GPUs in Container Clouds - https://ieeexplore.ieee.org/document/8672301
- tkestack/vcuda-controller - https://github.com/tkestack/vcuda-controller
- cGPU Container GPU Sharing - https://help.aliyun.com/zh/egs/what-is-cgpu
- Baidu Dual-Engine GPU Virtualization - https://xie.infoq.cn/article/64df7b9a6606c139753658758
- NVIDIA open-gpu-kernel-modules - https://github.com/NVIDIA/open-gpu-kernel-modules